Task 4 — Amdahl's & Gustafson's Law (Non-MPI)
Theory
Amdahl's Law (1967)
Gene Amdahl stated that the speedup of a parallel program is limited by its sequential fraction.
Where:
s= serial fraction (cannot be parallelized)p= number of processors1-s= parallel fraction
Maximum speedup (p → ∞): Speedup_max = 1/s
Example: With 10% serial code (s=0.1):
- 2 processors: 1.82×
- 10 processors: 5.26×
- 100 processors: 9.17×
- ∞ processors: 10× maximum forever!
Strong scaling: Fixed problem size, increasing processors.
Gustafson's Law (1988)
John Gustafson argued that Amdahl's Law is too pessimistic. In practice, we solve larger problems when we get more processors.
Where s = serial fraction of the parallel program, p = number of processors.
Example: With 10% serial code (s=0.1):
- 2 processors: 1.9×
- 10 processors: 9.1×
- 100 processors: 90.1×
Weak scaling: Problem grows proportionally with processors.
Key Difference
| Amdahl's Law | Gustafson's Law | |
|---|---|---|
| Problem size | Fixed | Scales with p |
| Serial fraction | Constant bottleneck | Shrinks relatively |
| Best use case | Real-time applications | Batch/scientific computing |
| Speedup limit | 1/s | Linear with p |
| Also known as | Strong scaling | Weak scaling |
Tool: Task Distributor
Task Distributor is a non-MPI parallel computing tool written by Prof. Dr. Christian Baun specifically for this course. It demonstrates Amdahl's and Gustafson's Law using POV-Ray (a 3D ray tracing renderer) as the workload.
GitHub: christianbaun/task-distributor
How it works
Master (Pi 5)
  ↓ SSH
  Divides image into N horizontal strips
  Sends one strip to each worker via NFS
  ↓ SSH
Workers (Pi 3-1..N)
  Each worker renders its strip with POV-Ray
  Saves result to NFS shared folder
  Writes hostname to lockfile when done
  ↑ NFS
Master
  Waits for all workers (polls lockfile)
  Assembles strips into final image with ImageMagick
Three timing components
T_seq1= lockfile creation + image split (serial)T_parallel= POV-Ray rendering on all workers simultaneouslyT_seq2= image assembly with ImageMagick (serial)
This structure directly shows Amdahl's serial fraction!
Setup
Requirements
- POV-Ray 3.7
- ImageMagick
- bc (basic calculator)
- NFS shared folder accessible by all nodes
Installation
# Install on Pi 5
sudo apt-get install -y povray imagemagick bc nfs-kernel-server

# Install on all Pi 3s
for i in 1 2 3 4 5 6 7; do
  ssh pi@192.168.50.$((90+i)) \
    "echo '1234' | sudo -S apt-get install -y povray imagemagick bc nfs-common" &
done
wait
NFS Shared Folder
# Create shared folder on Pi 5 NVMe
sudo mkdir -p /mnt/nvme/shared
sudo chmod 777 /mnt/nvme/shared

# Export via NFS
echo "/mnt/nvme/shared 192.168.50.0/24(rw,sync,no_subtree_check,no_root_squash,all_squash,anonuid=1000,anongid=1000)" \
  | sudo tee /etc/exports
sudo exportfs -a
sudo systemctl restart nfs-kernel-server

# Mount on all Pi 3s
for i in 1 2 3 4 5 6 7; do
  ssh pi@192.168.50.$((90+i)) \
    "echo '1234' | sudo -S mkdir -p /mnt/shared && \
     echo '1234' | sudo -S mount 192.168.50.1:/mnt/nvme/shared /mnt/shared"
done
Download Task Distributor
cd ~
wget https://github.com/christianbaun/task-distributor/archive/refs/heads/master.tar.gz \
  -O task-distributor.tar.gz
tar xzf task-distributor.tar.gz
cd task-distributor-master
Configure for Our Cluster
# Update hostnames to our Pi 3 IPs
sed -i 's|HOSTS_ARRAY=(\[1\]=pi110.*)|HOSTS_ARRAY=([1]=192.168.50.91 192.168.50.92 192.168.50.93 192.168.50.94 192.168.50.95 192.168.50.96 192.168.50.97)|' \
  task-distributor-master.sh

# Update POV-Ray path (Debian package installs to /usr/bin/)
for i in 1 2 3 4 5 6 7; do
  ssh pi@192.168.50.$((90+i)) \
    "sed -i 's|/opt/povray/bin/povray_3.7|/usr/bin/povray|g' ~/task-distributor-worker.sh"
done

# Fix lockfile path in worker
for i in 1 2 3 4 5 6 7; do
  IP="192.168.50.$((90+i))"
  ssh pi@$IP \
    "sed -i 's|/glusterfs/povray|/mnt/shared|g' ~/task-distributor-worker.sh && \
     sed -i 's|echo \"\`hostname\` \`date|echo \"$IP \`date|' ~/task-distributor-worker.sh"
done
POV-Ray Scene File
# /mnt/shared/scene.pov
#include "colors.inc"
#include "textures.inc"

camera {
  location <0, 2, -8>
  look_at <0, 0, 0>
  angle 45
}

light_source { <5, 10, -5> White }
light_source { <-5, 10, -5> color rgb<0.5,0.5,1> }
background { color SkyBlue }

sphere {
  <0, 0, 0>, 2
  texture {
    pigment { color Red }
    finish { phong 0.9 reflection 0.3 }
  }
}

plane {
  y, -2
  texture {
    pigment { checker color White color Black }
    finish { reflection 0.2 }
  }
}
Amdahl's Law Benchmark (Fixed Image)
Fixed 800×600 image, varying number of workers:
cd ~/task-distributor-master
for n in 1 2 4 7; do
  echo "=== n=$n nodes ==="
  rm -f /mnt/shared/lockfile /mnt/shared/*.png
  { time ./task-distributor-master.sh -n $n -x 800 -y 600 -p /mnt/shared; } \
    2>&1 | grep -E "Required|real"
  echo ""
done
Results
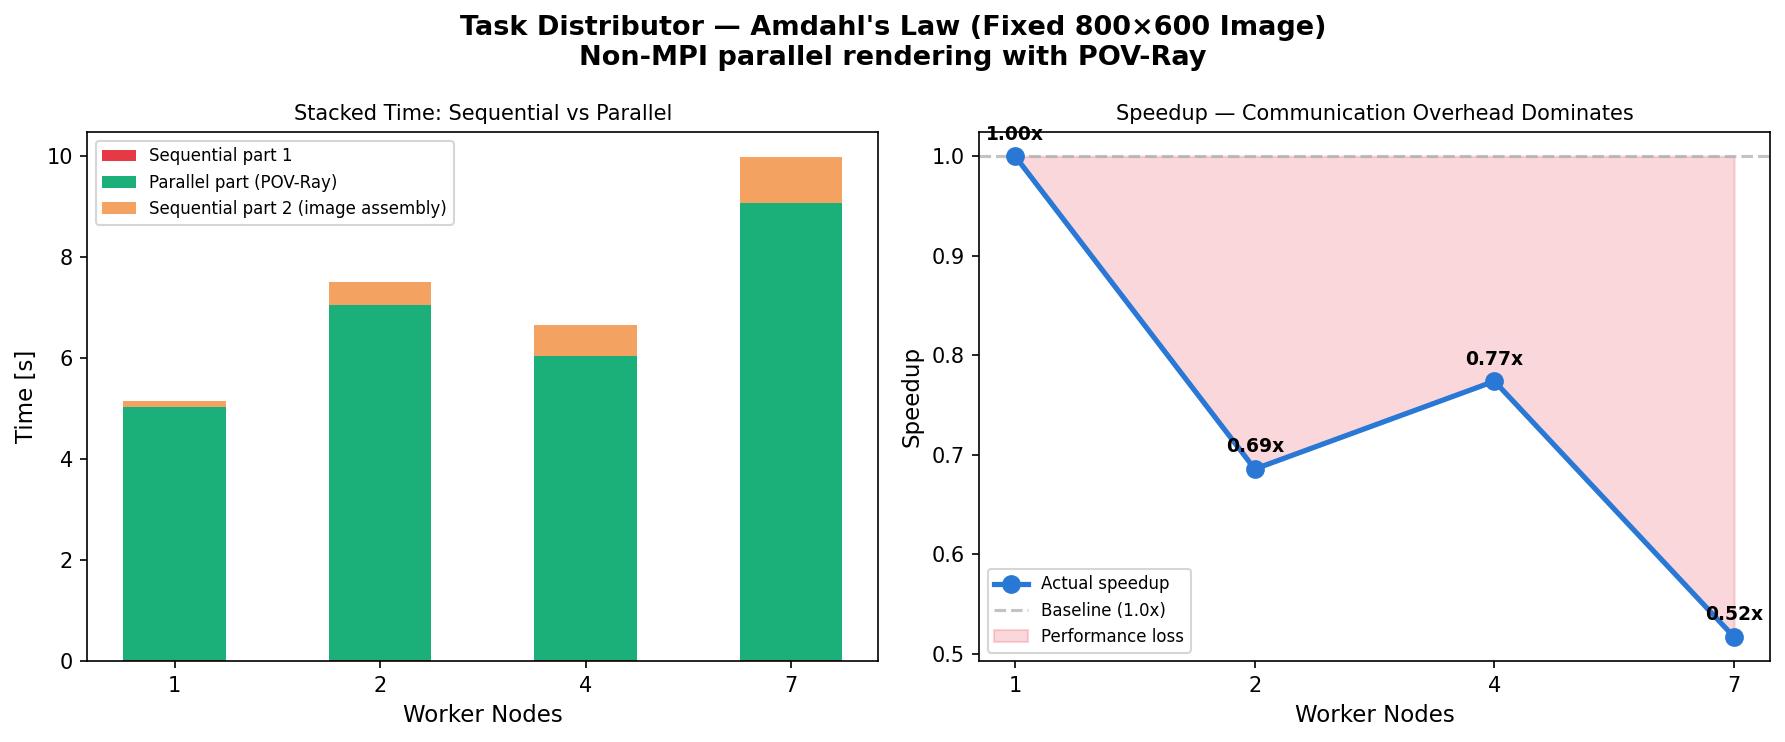
| Nodes | T_seq1 (s) | T_parallel (s) | T_seq2 (s) | Total (s) | Speedup |
|---|---|---|---|---|---|
| 1 | 0.018 | 5.020 | 0.106 | 5.166 | 1.00× |
| 2 | 0.030 | 7.030 | 0.453 | 7.534 | 0.69× |
| 4 | 0.016 | 6.033 | 0.606 | 6.675 | 0.77× |
| 7 | 0.016 | 9.060 | 0.902 | 9.995 | 0.52× |
Analysis
Why more nodes = SLOWER?
For an 800×600 image: each row takes ~0.008s to render on a Pi 3. 600 rows / 7 workers = 86 rows per worker = ~0.7s computation. But SSH setup = ~0.5s, NFS file transfer = ~0.3s. Communication (0.8s) > Computation (0.7s) → Amdahl's wall!
Serial fraction calculation:
But actual speedup DECREASES because our "parallel" part includes SSH and NFS overhead (which don't scale). The effective serial fraction including overhead is >50%.
Gustafson's Law Benchmark (Scaled Image)
Image size scales with number of workers:
for n in 1 2 4 7; do
  w=$((320 * n))
  h=$((240 * n))
  echo "=== n=$n nodes, image=${w}x${h} ==="
  rm -f /mnt/shared/lockfile /mnt/shared/*.png
  { time ./task-distributor-master.sh -n $n -x $w -y $h -p /mnt/shared; } \
    2>&1 | grep -E "Required|real"
  echo ""
done
Results
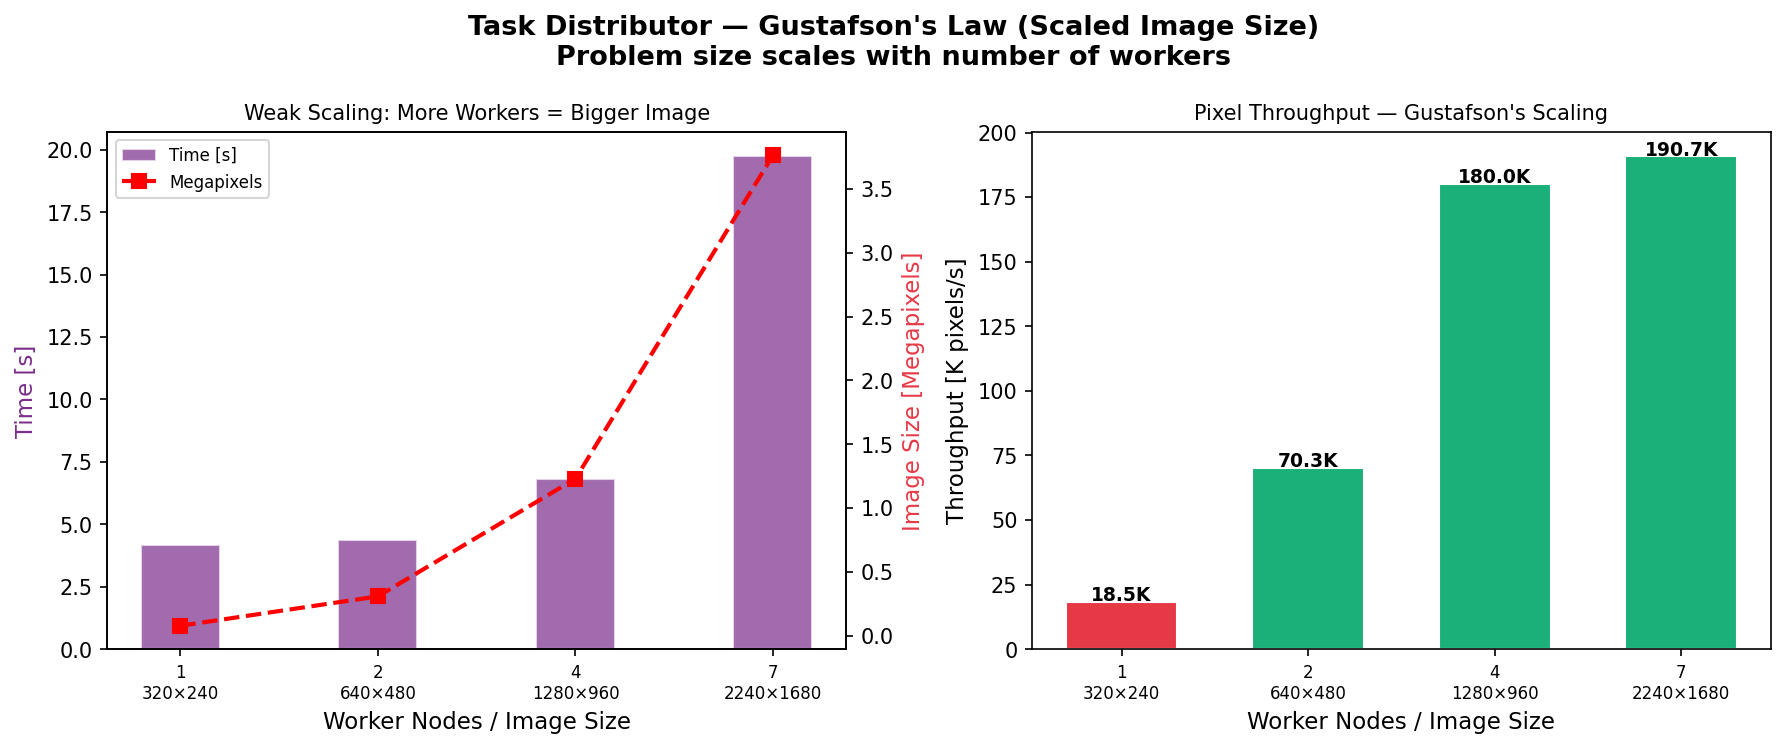
| Nodes | Image | Pixels | Time (s) | Pixels/s | Gustafson Speedup |
|---|---|---|---|---|---|
| 1 | 320×240 | 76,800 | 4.162 | 18,453 | 1.00× |
| 2 | 640×480 | 307,200 | 4.370 | 70,298 | 3.81× |
| 4 | 1280×960 | 1,228,800 | 6.825 | 180,044 | 9.76× |
| 7 | 2240×1680 | 3,763,200 | 19.730 | 190,735 | 10.34× |
Analysis
n=1 vs n=2: Nearly same time (4.16s vs 4.37s) but 4× more pixels rendered! This is Gustafson's Law: when the problem grows with processors, we process dramatically more work in approximately the same time.
Why n=7 gets slower? NFS bandwidth becomes the bottleneck when transferring a large (2240×1680 = 3.7 megapixel) rendered image over the network. The 10MB+ image transfer dominates.
Pixel throughput improvement: n=1: 18,453 pixels/second → n=7: 190,735 pixels/second (10.3× improvement!)
Comparing Amdahl's vs Gustafson's
| Metric | Amdahl (fixed 800×600) | Gustafson (scaled) |
|---|---|---|
| n=1 time | 5.166s | 4.162s |
| n=7 time | 9.995s (worse!) | 19.730s |
| n=7 speedup | 0.52× | 10.34× (throughput) |
| Conclusion | Communication > Computation | Computation scales |
The lesson: Use Amdahl's Law to understand limitations. Use Gustafson's Law to overcome them by scaling the problem.
Key Takeaways
- Small images (Amdahl regime): Communication overhead dominates. More nodes = slower.
- Large images (Gustafson regime): Computation dominates. More nodes = more throughput.
- The crossover point: When computation per node > communication overhead, parallelism helps.
- NFS bandwidth limit: For very large images (n=7, 2240×1680), network transfer becomes the new bottleneck — demonstrating that there is always a new serial fraction waiting to be discovered.
Frankfurt University of Applied Sciences — Cloud Computing SS2026 — Group 8